By Ellie DeGarmo, B.A., Junior Policy Associate
Can the well-being of a community be measured? Can it be quantified? The Siena College Research Institute (SCRI) developed a way to do both. In May 2017, SCRI conducted a public opinion survey of 1,000 New York State (NYS) residents, as a statewide community.
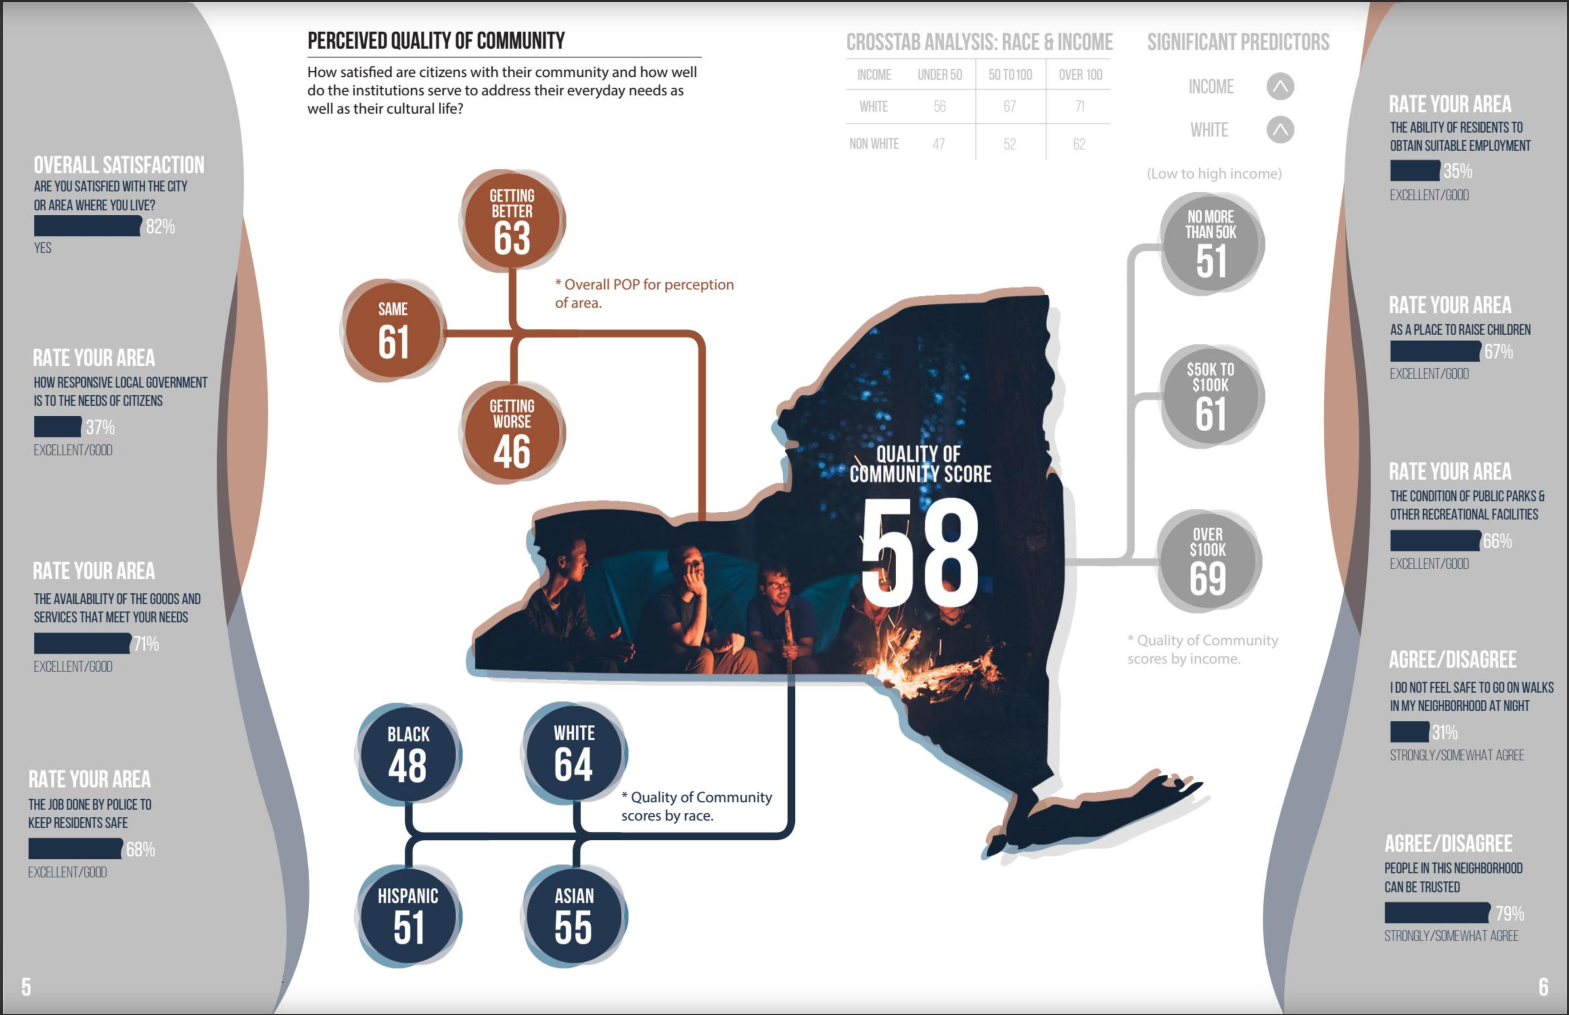
The survey comprised 80 questions, categorized in groups, addressing six different indicators: community quality; civic engagement; personal and mental health; life chances of young people; economic well-being; and presence of discrimination. Answers were scored on a scale from 0 to 100. The weighted averages of these scores form the Percent of the Possible (POP) score, which quantifies the well-being of a community. While the general POP score provides an overview, a deeper look at the question-level data may provide more useful insights for actionable interventions. SCRI used demographic characteristics such as race, ethnicity, income, gender, and education, to identify subsets within the statewide community.
Answers from several survey questions are important for gauging the ways in which the built environment impacts health. For example, Question 10A, found in the crosstabs data file, asked respondents how much they agree or disagree with the statement, “I do not feel safe to go on walks in my neighborhood at night.” Nearly half (49 percent) of individuals with incomes less than $30K either somewhat agreed or strongly agreed, while only 14 percent of individuals with incomes over $100K somewhat or strongly agreed with this statement. These results have implications beyond that of feelings of safety. Lower-income individuals, who may arrive home from work after dark, are less likely to engage in walking outside as a form of exercise. Lacking the option to engage in physical activity of this kind may increase their risk of developing chronic diseases like heart disease and obesity.
In addition to walkability, access to transportation also impacts health. To this end, survey respondents were asked: “do you have access to a car when you need it?” Individuals in the lowest income bracket were ten times more likely than individuals in the highest income bracket (30 percent versus 3 percent) to respond with “almost never” or “never at all.” This is significant, particularly in rural communities, where public transportation is lacking and long distances are required to receive necessary medical care. A similar disparity is reflected when looking at the breakdown of responses to this question according to race and ethnicity, in which white individuals answered this way 6 percent of the time, whereas African Americans and Hispanics responded this way 27 percent and 33 percent of the time, respectively.
Although these results offer some insight about the well-being of NYS as a state-wide community, a larger sample would generate accurate metrics of well-being in communities of smaller size. SCRI worked with DataHaven on a survey of over 16,000 Connecticut residents in 2015. SCRI hopes to conduct a survey of comparable size in New York, in the future. With a much more robust sample, dynamic and dramatic differences will emerge between smaller geographic areas. This information could inform the implementation of more targeted and tailored health interventions.
Measuring the well-being of a community is an abstract concept and SCRI has developed a set of useful metrics as a baseline against which future progress can be measured. As a part of the work of the New York Academy of Medicine, the Advancing Prevention Project (APP) provides technical assistance and tools for individuals working at local health departments. However, we encourage professionals across various sectors to download SCRI’s booklet and explore their data as a means for improving the lives of individuals in New York State.